
It comes as no surprise that the overall number of properties for sale (listings) declined during the period of May thru July 2011. (Anyone that has been in the city knows the commitment it takes to search for an apartment in the recent heat.) I do anticipate that number of listings will jump in September/October as everyone settles into the rhythms of the fall season. But, different neighborhoods posted different levels of decline in listing volumes.
See the graphic, local numbers, and insight into the differences after the jump
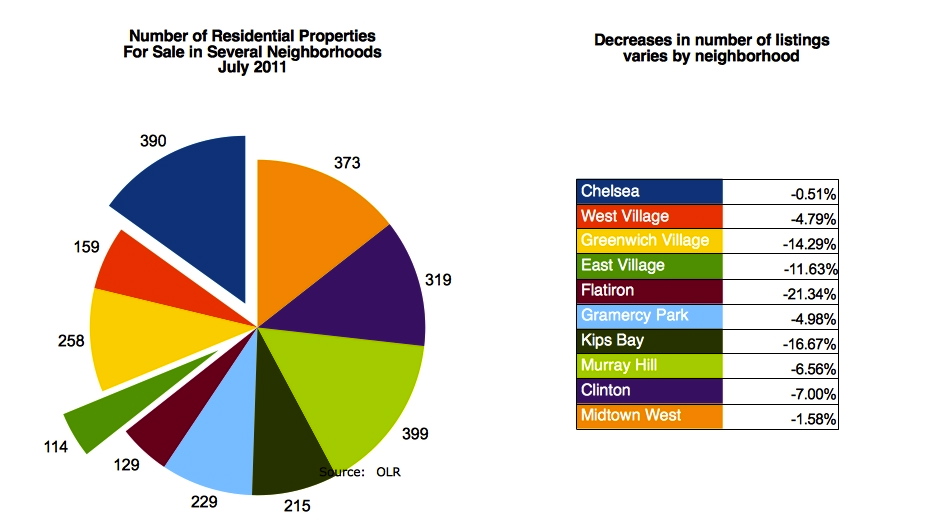
Behind the Numbers: Number of Residential Properties For Sale in Several Neighborhoods, July 2011
The number of listings per neighborhood ranged from a low of 114 listing in the East Village to a high of 399 listings in Murray Hill. The decline in listing volumes between May and July also ranged significantly from -0.51% in Chelsea to 21.34% in the Flatiron. Additional local data is shown in the charts.
Now, what's behind these numbers?
A further look suggests that may depend on each neighborhood. Here are some of my conclusions from the data:
- Chelsea – New condos provide stable inventory levels
- Midtown West – Balance of new listings & contracts
- Gramercy Park – Rising prices entice more sellers
- Greenwich Village – Less inventory drives prices up
- East Village – Lower sale prices delays new listings
No comments:
Post a Comment